文件格式说明
文件格式
我们将数据储存在HDF5文件中,其中有三个表:TriggerInfo保存触发的时间戳信息;Waveform保存波形信息;GroundTruth保存每个光子的击中时间,即标签信息。每个表都有对应的事例编号或通道编号,如下所示。
| TriggerInfo | ||
| EventID (int64) | Sec (int32) | NanoSec (int32) |
| 1 | 0 | 89692193 |
| 2 | 0 | 109000153 |
| 3 | 0 | 201205243 |
| … | … | … |
| Waveform | ||
| EventID (int64) | ChannelID (int16) | Waveform (int16 [1029]) |
| 1 | 0 | 974, 973, …, 972 |
| 1 | 1 | 973, 974, …, 975 |
| 1 | 2 | 973, 973, …, 974 |
| … | … | … |
| GroundTruth | ||
| EventID (int64) | ChannelID (int16) | PETime (int16) |
| 1 | 0 | 269 |
| 1 | 0 | 284 |
| 1 | 0 | 287 |
| … | … | … |
使用HDFView打开数据文件,可以查看文件的大致结构
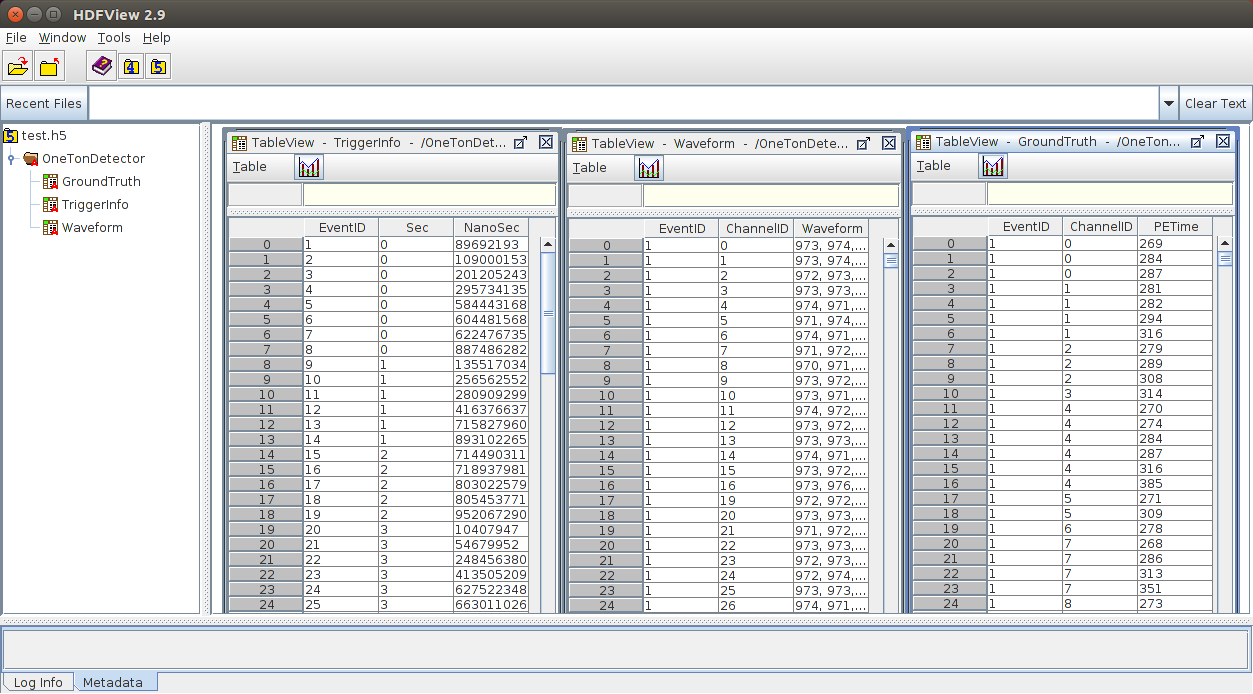
数据文件的结构
读取文件的示例
Python
利用Python的pytables模块,
pip install tables
我们可以方便地读取hdf5文件。
import tables
import matplotlib
import matplotlib.pyplot as plt

# Read hdf5 file
filename = "test.h5"
h5file = tables.open_file(filename, "r")

WaveformTable = h5file.root.Waveform
entry = 0
EventId = WaveformTable[entry]['EventID']
ChannelId = WaveformTable[entry]['ChannelID']
Waveform = WaveformTable[entry]['Waveform']
minpoint = min(Waveform)
maxpoint = max(Waveform)

GroundTruthTable = h5file.root.GroundTruth
PETime = [x['PETime'] for x in GroundTruthTable.iterrows() if x['EventID'] == EventId and x['ChannelID']==ChannelId]
print(PETime)

plt.plot(Waveform)
plt.xlabel('Time [ns]')
plt.ylabel('Voltage [ADC]')
for time in PETime:
    plt.vlines(time, minpoint, maxpoint, 'r')

plt.title("Entry %d, Event %d, Channel %d" % (entry, EventId, ChannelId))
plt.show()

h5file.close()
这段程序将Waveform表中的第一个记录读取,并在GroundTruth表中取出对应的光电子到达时间,将其画出。得到的图像为
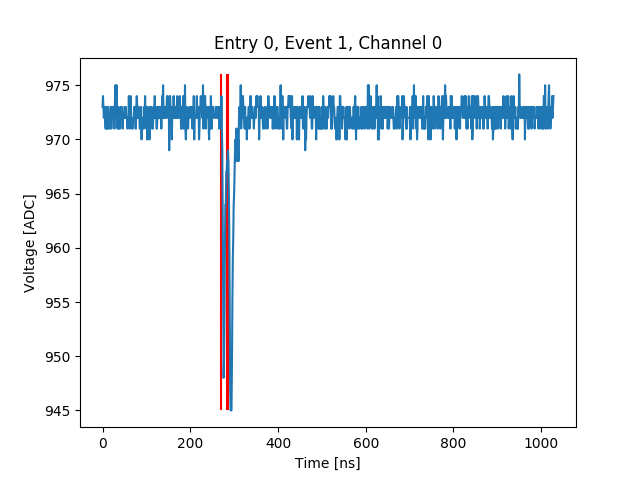
波形和击中时间的示例图
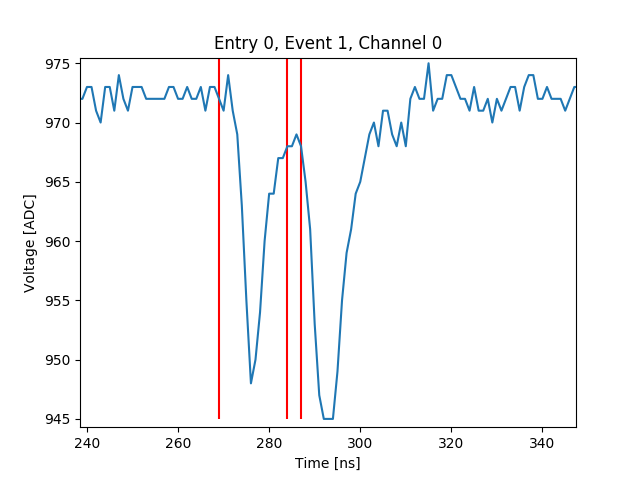
波形局部放大
可以看出该PMT上有3次击中,其中后两次离得较近,两个波形叠加得到一个较大、较宽的波形。
C++
HDF5原生库提供了C/C++的支持。编译安装HDF5库后指定头文件目录和库即可编译下面的示例代码
g++ -std=c++11 -o test -I/usr/local/hdf5/include/ ReadExample.cpp -lhdf5 -lhdf5_hl
#include "hdf5.h"
#include "hdf5_hl.h"
#include <stdlib.h>
#include <iostream>
using namespace std;

constexpr size_t nWindowSize = 1029;
constexpr size_t nFields = 3;

struct WaveformData
{
    long long EventID;
    short   ChannelID;
    short   Waveform[nWindowSize];
};

int main()
{
    WaveformData wf_buf;

    /* Calculate the size and the offsets of our struct members in memory */
    size_t dst_size =  sizeof(WaveformData);
    size_t dst_offset[nFields] = { HOFFSET( WaveformData, EventID ),
        HOFFSET( WaveformData, ChannelID ),
        HOFFSET( WaveformData, Waveform )
    };
    size_t dst_sizes[nFields] = { sizeof(wf_buf.EventID),
        sizeof(wf_buf.ChannelID),
        sizeof(wf_buf.Waveform)
    };

    hid_t file_id = H5Fopen( "test.h5", H5F_ACC_RDONLY,  H5P_DEFAULT);
    hid_t group_id = H5Gopen(file_id, "/", H5P_DEFAULT);
    H5TBread_records( group_id, "Waveform", 0, 1, dst_size, dst_offset, dst_sizes, &wf_buf);
    for(int i=0; i<nWindowSize; i++)
        cout<<wf_buf.Waveform[i]<<", ";
    cout<<endl;

    H5Fclose( file_id );
    return 0;
}
这段程序读取了Waveform表中的第一条记录,并把波形数值打印了出来。